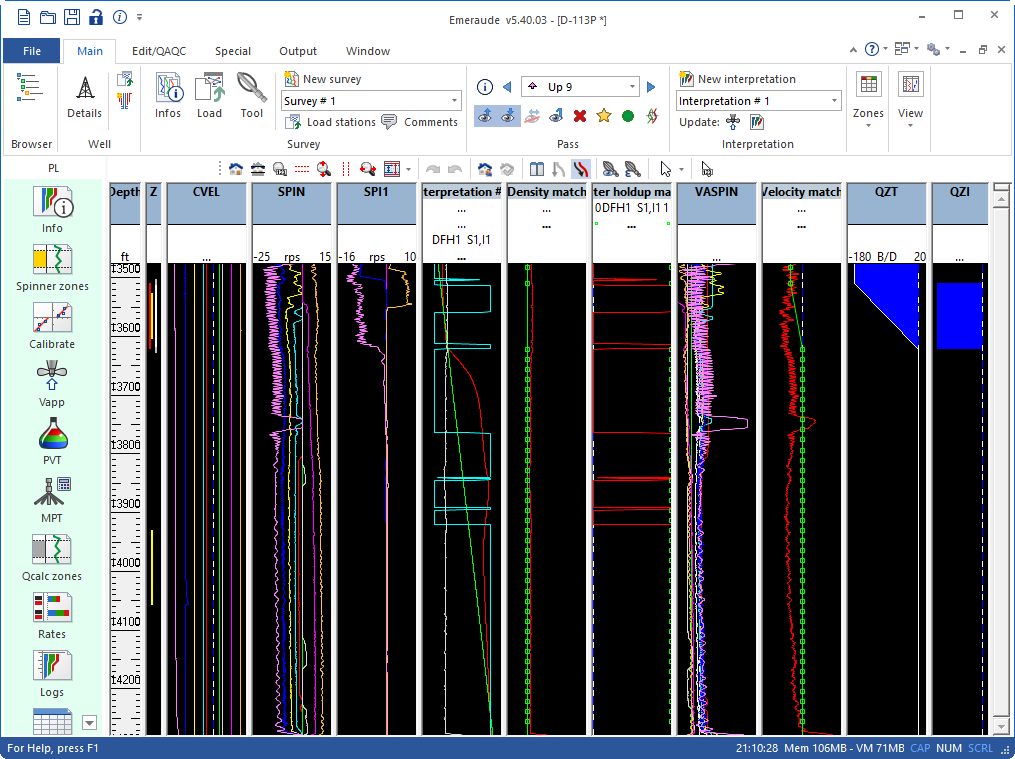
بررسی نمودارهای تولید | KAPPA Emeraude 5.40.3

KAPPA Emeraude is the leading provider of Dynamic Data Analysis software, training and consulting services. Data are analyzed on whatever scale is available, from high frequency, high resolution transient data through low frequency, low resolution rate data in production analysis and on into full field history matching and vertical description using production log and formation test analysis.
Emeraude v5.40 is a major release with many important additions. These bullets summarizes the changes if you are moving from Emeraude v5.20 or v5.30. The points highlighted in yellow were introduced in 5.40.01, while the others were introduced in v5.30.01.
Multi-finger caliper
- Loaded in surveys, with Nominal ID, OD, Weight, Drift from catalog if not in source file. Stores array data and pass logs. Associated browser node (copy, rename and move to another survey possible). MFC columns automatically activated based on rootmnemonic.
- Specific edit options in Explore: Bad finger replacement, Centralization,Recalibration.
- Radiusanddiameterstatisticsautomaticallycalculatedorupdated,aswellasmaximumpenetration(PEN), ovalization (OVAL), relative wall displacement (RWD), coefficient of variation (CV), Reduction (RED), Metal loss.
- Display image, Diagnostic track, Radius track and PEN, OVAL, RWD, CV, RED, Metal loss tracks. Cross- sectionviewavailableinExplore,withdetailedresultsatselecteddepth.Imagedisplaycanaccountfortool bearing.
- Joints table available after automatic, interactive or manual identification. A Joints track isdisplayed.
- Explore option available for MFC data in reader mode (no edit).
- Display image, Diagnostic track, Radius track and PEN, OVAL, RWD, CV, RED, Metal loss tracks. Cross- sectionviewavailableinExplore,withdetailedresultsatselecteddepth.Imagedisplaycanaccountfortool bearing.
· 3D MFC display accessible from the Explore. Accounts for tool rotation and well deviation. Joints navigation. Clipping based on finger index. Free 3D rotation. Displays DRID, ID and OD. Display can be filtered on radius value. Allows recording a movie and taking snapshots.
Noise logging data
· Load vs. time data with varying depth from the ‘Load Stations’ dialog. Noise data treated as array.
Frequency cut-offs and other measurements are also loaded. Associated browser nodes.
· The Explore shows data vs. time (horizontal orientation). Stations automatically identified based on cable speed or depth. Stations displayed in dedicated track, where they can be edited, added or deleted.
· The vs. depth Noise array is generated from the stationary measurements based on an instantaneous, median or average value along certain range.
· For tools with multiple hydrophones in the same file, different noise arrays are created upon loading.
Individual processing and synchronization.
· Vs. depth Noise array can be displayed interpolated, extended or at depth. Further editing from Explore.
· Calculation of the Normalized Energy and Spectrum Centroid. Reconstruction of the vs. time logs to be displayed in vs. depth tracks.
· Vs. Depth Noise data can also be directly loaded from the ‘Load’ dialog.
Cement evaluation data
· Built-in mnemonics for common cement tools. New measurements of Acoustic Impedance, Attenuation and Slowness.
· External DLLs for Bond Index, Cement flags, Overall Isolation and Attenuation.
· New Well Integrity.kvt template file with standard layouts for different cement tools.
Array data
- Option to average N traces before importing the data into Emeraude, or to keep only one trace everyN.
- EditoptionsinExploreorEmerauderibbon:depthshift,deleteparts(ondepthranges),a&bonindividual traces (manual, interactive, automatic), filtering, derivate, depth stretch, zone stretch, Multipoint depth correlation.
- Traces for Logs track can now be selected interactively in Explore (click and drag on the image track). A color scale can be associated with traces in Logs track, and the color is used for extracted traces in Emeraude.
- Explore display settings extended (in ribbon), with video speed or ability to show/hide anytracks.
- Copy array data option on browser node popupmenu.
- It is now possible to show gaps in array image when some traces are missing (i.e. without interpolation in thegap).
- TheMeasurementatdepth plot,belowthemain(depth)plot,cannowdisplaydataofotherarrayspresent inExplore.
Stationary data
- Traces for Logs track can now be selected interactively in Explore (click and drag on the image track). A color scale can be associated with traces in Logs track, and the color is used for extracted traces in Emeraude.
- TheMeasurementatdepth plot,belowthemain(depth)plot,cannowdisplaydataofotherarrayspresent inExplore.
· Model revised: measurements are now stored vs time rather than vs depth. No need for monotonous depths.
· Allows editing options, Mathpack, DLL and Resample.
Log data editing
- Survey stretch factor calculator (in Depth scaleoption).
- Interactive stretch with multipoint correlation (interactive and manual).
- Larger filter window with Apply button for trial anderrors.
- It is now possible to average multiple channels of the same type with differentmnemonics.
- Zones can be input of Math Pack and DLL (0 outside, 1 inside).
- Integral calculation vs. depth ortime.
- User DLL API updated with new datatypes.
Interpretation
- Steam injection interpretation with surface constraint (injected rate and vaporquality).
- Apply button to generate Vapplogs.
- Names associated to spinner calibrationzones.
Display
- Filled areas in automatic tracks, with easier editing andtransparency.
- Explicit deviation selection when creating / editing a wellview.
- Custom zones can be defined. Displayed in a dedicated track and can be used asmarkers.
- Zoom toolbar available for all XY plots (calibration, SIP,cross-plots…).
- Depth plot zoom toolbar now offers Set Default and Reset Default.
Cross-plots
- Can create N plots showing data over selected custom zones or stations. A node is associated in the browser.
- Channels can be created based on up to 4 different logs (X, Y, point color, pointsize).
- A histogram plot can be associated with X log, and another one to Ylog.
- Lines can be fitted on channelpoints.
- Can be added to print report and copied to clipboard(CTRL+C).
- Templates can be captured andinvoked.
Histogram plots
- Can create N plots showing data over selected custom zones or stations. A node is associated in the browser.
- Number of bins, bars orientation (vertical or horizontal) and stacked type (possibly normalized, %) can be specified. For each bin, mean, median and number of points isavailable.
- Can be added to print report and copied to clipboard(CTRL+C).
- Templates can be captured andinvoked.
Multiple Probe Tools
- Application settings window revised for easier toolaccess.
- MPT process with independent selection of Y and V models, new 2D interpolation model available, and new Non-linear holdup correction possible (velocitydependent).
- Additional FAST tools (MRIO, MCDE, BCO, BCE) and mnemonics (tools ordered by category in the Applicationsettings).Enrichedviewtemplatesaccordingly(Cross-sectionviews,HU/HD/Holdupview,LQC full layout with HU/HD, Image and Cross-section Views). Option to compute holdups from raw measurements (optical and electricalprobes).
· FAST holdup calculation includes fluid absence constraint vs. depth.
- Cross-section track available for any tool, including FSI. Updated view template files for allvendors.
- Depth synchronized cross-sectionwindows.
- Spinner velocity image view template added to view template files for FAST, PAI,AFV.
- Tools ordered in lists where they appear (Survey – Tool, MTP process, invoketemplate…).
- Default image orientation for PAI tool is nowBottom.
Miscellaneous
- Lock document with a Document Unique Identifier(GUID).
- New EMERAUDE tab on the Emeraude sample Word report is available, with additional macros to insert cross-sections, MFC penetration summary,etc…
تیم PetroTools آخرین نسخه این نرم افزار را برای شما ارائه می دهد. جهت تهیه نرم افزار با استفاده از منوی خرید با ما در تماس باشید
For buy software, Please contact us via buy menu


 O-Sense
