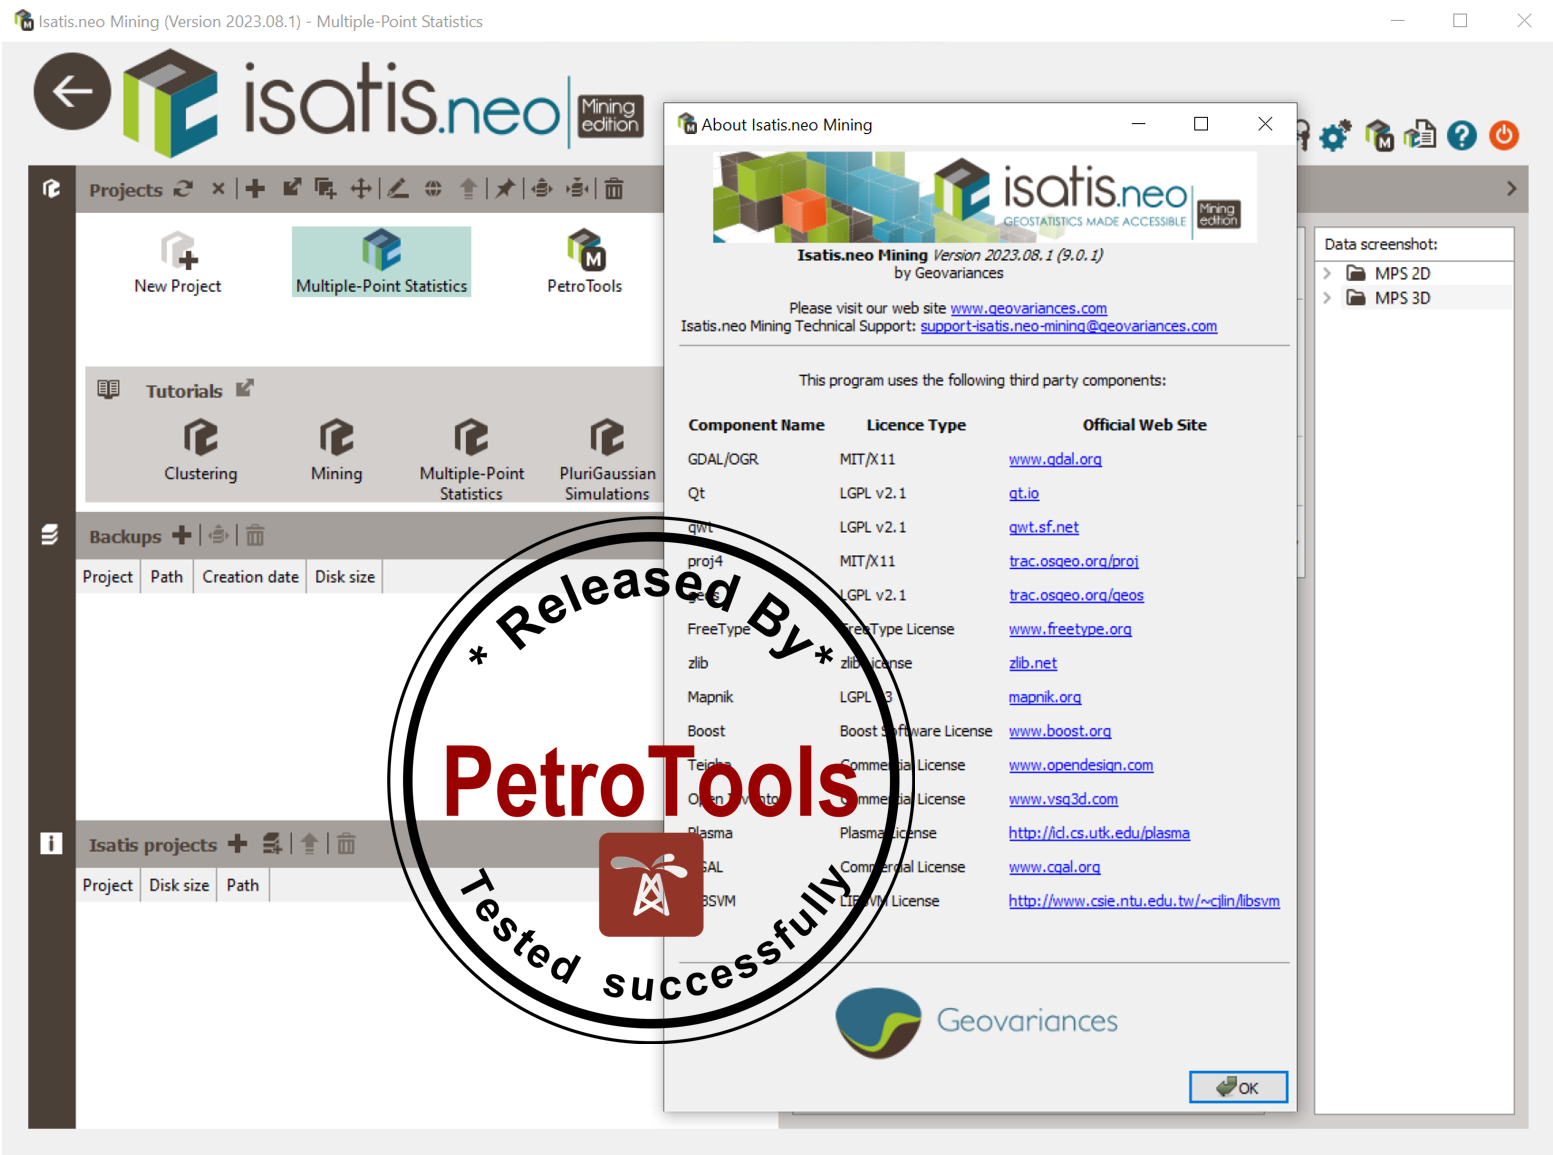
مدل سازی زمین آماری | Isatis.neo 2023.08

Isatis.neo is the leading and most comprehensive software solution for geostatistics. Featuring an intuitive user interface, it results from Geovariances’ dual commitment to developing breakthrough technology and making premium geostatistics accessible to more users. Designed for every business dealing with spatialized data, Isatis.neo exceeds industry standards in geostatistics. The software enables thorough data analysis and visualization, produces high-quality maps and models, and allows you to carry out extensive uncertainty and risk analyses that optimize your decision-making process.
Available in a Standard Edition, Isatis.neo is also offered in two special versions, Petroleum Edition and Mining Edition, to better meet the specific requirements of these two industries. In addition to business-oriented tools, the Petroleum Edition offers a preconfigured workflow for Time-to-Depth Conversion with comprehensive uncertainty analysis.
WHAT'S NEW IN ISATIS.NEO 2023.08?
IMPROVEMENT OF DATA EXPLORER
To make it easier to find a particular variable or file and have a clearer data tree, you can now hide given variable types from the list, filter variables, files, and directories by searching for a specific character string, and order them according to their name, type, creation, or modification date.
IMPROVEMENTS IN DATA PREPARATION AND ANALYSIS
The new version facilitates the creation of new category variables by merging existing ones.
When capping, you can now see which samples are capped and get the number and proportion of capped samples.
You can compute the Spearman rank correlation coefficient in addition to the Pearson correlation coefficient, which is useful when the relationship between two variables is not linear.
IMPROVEMENTS IN ESTIMATION AND SIMULATION
The Multiple Indicator Kriging workflow has been significantly improved, making it simpler and faster. It facilitates the cutoff definition from a variable distribution visualized in a cumulative histogram to help with fitting. Additionally, it speeds up the kriging run on the various indicators with a new option to run calculations only once, estimating each indicator sequentially. It also features a new method, the class mean, to calculate e-type estimates. Lastly, the block variance can be derived directly from the point variance using the volume-variance correction factors, avoiding going through the Support Correction task.
Multiple-point Simulations generate new statistics for continuous simulated variables such as mean, standard deviation, variance, minimum, maximum, quantiles, and confidence intervals, as well as mean, probability, and accumulation above a threshold.
IMPROVEMENT OF DISPLAY
If you use both Isatis.neo and Studio RM, you can now share your favorite Datamine color scales between both software solutions.
You can also standardize the appearance of graphics by setting new global preferences.
IMPROVEMENTS OF BATCH FUNTIONALITIES
Several new options in the batch interface make debugging easier. You can now generate a debugging batch file, browse the batch file, or set a breakpoint in the workflow to stop it on a specific task.
The Batch Editor now allows you to replace empty values and access additional features via a contextual menu with a right-mouse click, such as opening included files, copying selection structures, or opening Python scripts.
EARLY-ACCESS MENU
The Early Access menu gives you access to functionalities, the interfaces of which are not optimized. It offers advanced users the opportunity to test them and give their feedback to orientate the latest developments.
BORDER ANALYSIS
A new powerful Border Analysis tool enables you to analyze variable behavior across domains. These domains can be defined by lithologies, weathering zones, grade shells, or grain size classes using cutoffs, categorical variables, or macro selection variables.
You can analyze the evolution of a variable based on the distance between two samples – one in a domain and the other in another domain – and assess the type of contact between two domains, whether hard or soft, by analyzing how a variable varies close to a contact. Additionally, it helps understand domain connectivity, how domaining affects grade spatial variability, and analyze variable spatial continuity. The analyses can be made along specific directions or globally.
Possible applications of Border Analysis include selecting the best method for estimating between Multiple Indicator Kriging, which often corresponds to a mosaic model, or Uniform Conditioning, which usually fits a diffusive model. It can also help set the appropriate lithotype rule for performing Plurigaussian Simulations (PGS) and validate domains after automatic classification.
تیم PetroTools آخرین نسخه این نرم افزار را برای شما ارائه می دهد. جهت تهیه نرم افزار با استفاده از منوی خرید با ما در تماس باشید
For buy software, Please contact us via buy menu


 O-Sense
