

 O-Sense
تفسیر سایزمیک هالیبرتون | Landmark Discovery 2019.1

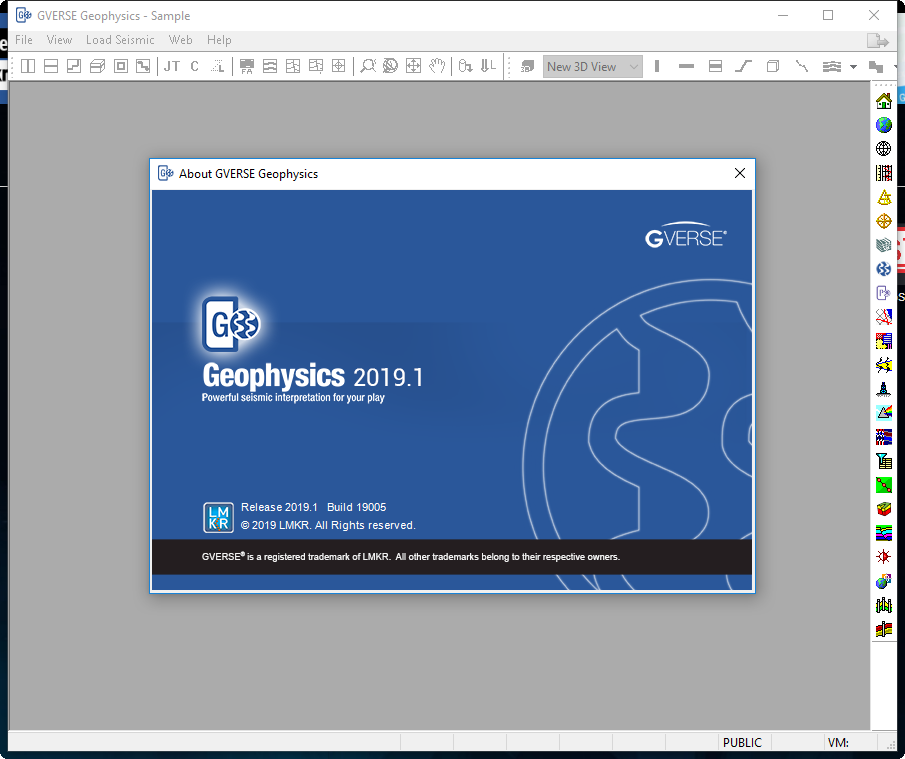
GVERSE® Geophysics (Landmark Discovery 2019.1) is the most powerful seismic interpretation and mapping software package available for use with the Microsoft® Windows® operating system. GVERSE Geophysics on OpenWorks®, a licensed option within GeoGraphix® Discovery Suite™, allows users to access and modify a SeisWorks® project located on a UNIX® server (seismic, horizon, and fault data) within a GVERSE Geophysics interpretation on a PC. Designed for fully integrated interpretation using all available data -- geologic, petrophysical, and geophysical -- GVERSE Geophysics and GVERSE Geophysics on OpenWorks share a common database with and direct access to the geologic interpretation system of GeoGraphix Discovery, plus direct access to PRIZM™, GeoGraphix Discovery's petrophysical interpretation system.
بررسی نرم افزار Landmark Discovery 2019.1:
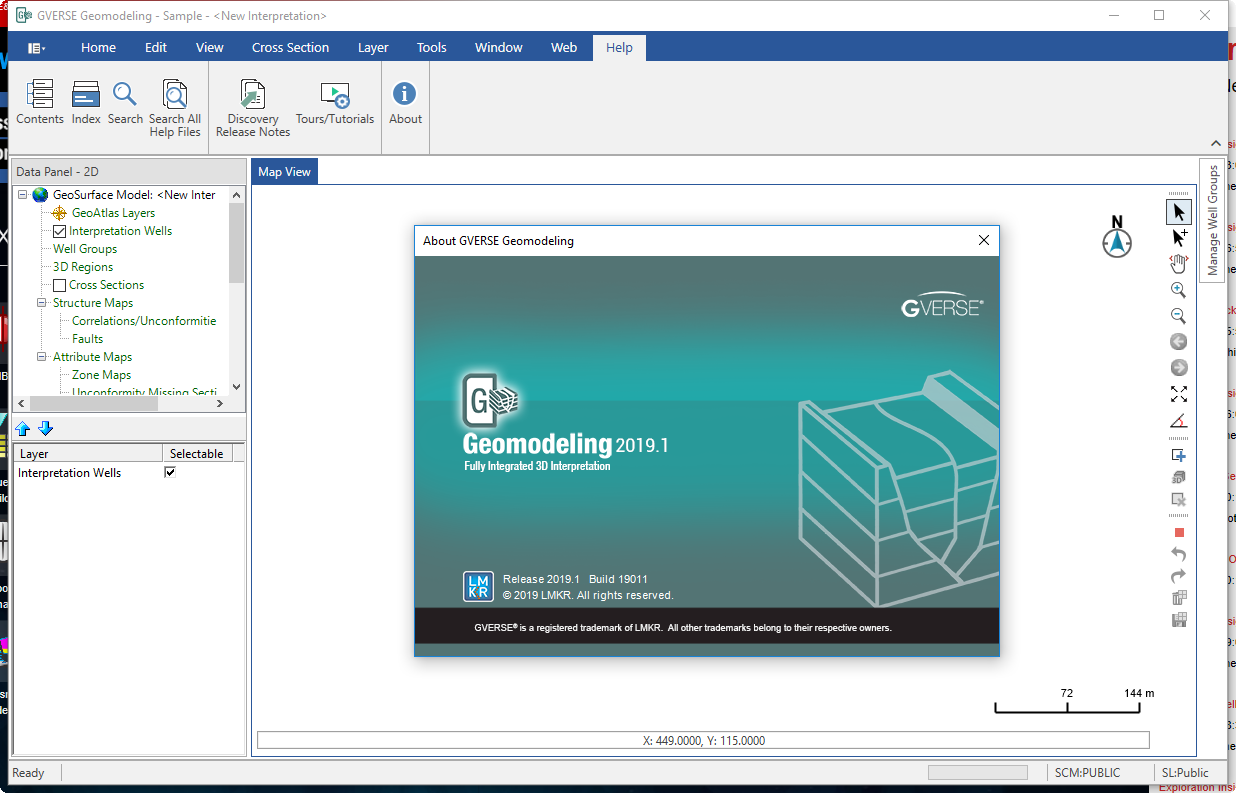
GVERSE Geomodeling
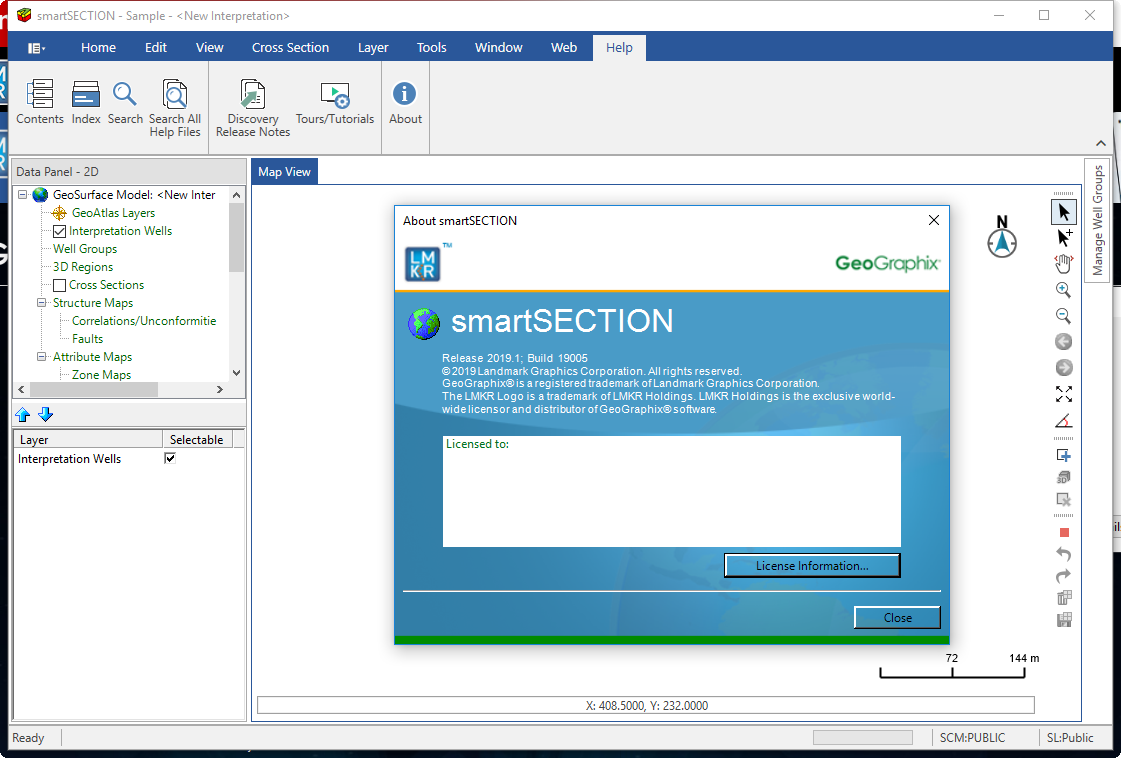
The GVERSE Geomodeling is an integrated environment for modeling that incorporates existing mapping and cross section features of smartSECTION with a newly built 3D View. It takes your smartSECTION interpretations to a whole new level with 3D modeling, while also enabling you to fully utilize the existing smartSECTION features.
The foremost objective is to provide an integrated real-time 3D visualization of a developing geomodel. You can integrate petrophysical, geophysical, drilling, and GIS data into your interpretation to create the most comprehensive geomodel possible.
DefCon2
The DefCon2 program has been designed to allow users to define the format of ASCII data files to be imported into the WellBase database, the LandNet survey database, and/or to LandNet layers. The resulting import definition contains the information necessary to parse the data from the ASCII file and store it in the selected WellBase or LandNet database or LandNet layer. The information in these Help files should allow you to build import definitions for most simple data formats.
Depth Registration
DepthRegistration provides raster image display capabilities for XSection smartSECTION and PRIZM. Raster images of logs, core, diagrams or any image applicable to a well bore can be imported or opened in DepthRegistration.
Discovery™ 3D
Discovery™ 3D is the GeoGraphix® Discovery™ module that shows well, geological, and geophysical data in a three-dimensional view.
Discovery 3D utilizes state-of-the-art gaming technology to create exceptional quality three-dimensional views.
Note: Discovery 3D requires a Windows 7 operating system, a 64-bit platform, and a video card compatible with DirectX 10 or higher.
Well information that can be shown in Discovery 3D includes wellbores, logs, formation tops, and microseismic events. Surfaces created in smartSECTION® with FrameBuilder™ can be shown by selecting them from a project or by the interactive smartSECTION Live feature, which will reflect changes to the smartSECTION interpretation immediately. GeoAtlas layers can be shown either as a structure layer if it was created in IsoMap, or draped at the surface location or draped on another structure layer. Seismic lines can be shown and compared to the well data or interpretation.
The spatial extent of the 3D volume is essentially the spatial extent of the project data, which can be anything from a regional reconnaissance-level project to a detailed reservoir characterization level project.
Well Editor
The Well Editor is a multi-purpose geophysical application that is used to interactively edit well logs and evaluate synthetic trace character response when tieing seismic data to well locations.
The Well Editor can also be used to display SEG-Y traces, AVO/AVA synthetics, exploded synthetics and user-defined phase and frequency panels. It also includes an extensive Fluid Substitution option used for modeling sub-surface rock and fluid parameters.
The other options include a math toolkit, full wavelet editing, check shot support and complete wavelet extraction. Deviated wells can also be displayed with their associated synthetic traces, which are automatically updated whenever the well curves are edited.
Model Builder
The Model Builder is a primary LogM application that starts where the Well Editor leaves off. The Model Builder is used to assemble geological cross sections from well logs from which interpolated synthetic trace models are generated. These trace models are typically used as an empirical modeling tool for evaluating the character of anomalous seismic responses between wells.
AVO/AVA models can also be generated, stratigraphic relationships defined for each layer and new or existing correlations drawn and easily edited with lithology patterns displayed between correlations. In addition, horizon trace attributes can be displayed and plotted with each generated trace model.
Engineer's Dashboard
The GeoGraphix® Engineer's Dashboard combines the data analysis capabilities of Microsoft® Excel® with the display and presentation features of the GeoGraphix Discovery™ suite. Generate an Excel PivotTable™ from WellBase® and use analysis tools in Excel to quickly summarize data, create calculated fields and apply formulae to the data. Filter and organize information in Excel, then use the GeoGraphix Engineer's Dashboard Add In to display data associated with the selected information on a GeoAtlas™ Map, in WellBase™, in Google Earth™ and ZoneManager™.
Field Planner
Effective field planning is essential for making the right exploration and production decisions. The process involves determining the optimum location and orientation for wells and well pads. The Field Planner dialog box allows you to create plans, add (or create) well pads, determine the number of wells on each well pad, and determine their location and orientation. The wells are based on user-defined constraints (such as spacing between wells, height of toe above heel, kickoff depth, etc.) which can be edited to suit your preferences.
You can instantaneously create a layer in GeoAtlas to display your field, well pads, and wells. Field Planner saves planning time and helps reduce costs to a large extent.
FK-Migration
The FK-Migration option used in Struct applies Stolt’s method of Frequency Domain migration to a 2D seismic dataset. The input dataset is typically a diffraction seismic model, generated by Struct.
Substitution
Fluid Substitution is a method used to estimate shear velocities and perform fluid substitutions using the Greenberg-Castagna, Gassmann's and related methods.
The implementation of fluid substitution uses two applications of Gassmann's equation - the first, to go from the in-situ saturation state to the dry rock state (where all fluid is removed), and then second, to go from the dry rock state to the new saturation state, adding the new fluid.
Fluid Substitution is a technique often used when more accurate modeling of synthetic traces and well cross-sections containing hydrocarbon bearing rocks is required. An example is where the output curves are used with AVO analysis to observe the effect on seismic response with different fluid / gas mixtures.
GeoAtlas
GeoAtlas™ is the mapping environment for Discovery™ Geology. Use GeoAtlas to display, modify, and arrange layers created in other GeoGraphix® Discovery™ or Discovery™ on OpenWorks® applications to create maps and montages. In GeoAtlas, you can:
- Create maps, modify map attributes, add drawings, objects, and annotations, and print maps.
- Use a contouring shortcut to quickly create contour layers from posted Z-values such as formation top depths or porosity values.
- Use the scale-dependent resolution feature to determine at what scale a layer, entity type, or text feature appears on the map.
- Construct montages displaying maps and cross sections, as well as inserted text and graphics files defined in other applications
The 32-bit base mapping environment of GeoAtlas uses ESRI®'s Map Objects, which offers graphical flexibility by supporting layers built in the GeoGraphix Discovery and Discovery™ on OpenWorks® data applications. Map Objects also allows for spatial querying.
Geosteering Correlation Tool
The smartSECTION Geosteering Correlation Tool (GCT) is designed to assist both the geosteering engineer and geologist in interpreting the position of the borehole relative to the smartSECTION FrameBuilder 3D geological model. The geosteering engineer can use the Geosteering Correlation Tool to determine the position of the wellbore as compared to the well plan and the target zone. Once the wellbore position is determined, the geosteering engineer can use the Distance and Angle tool to set the target line and communicate it to the drilling engineers in the field. The geologist can use the Geosteering Correlation Tool to correlate the wellbore to the geological model along the horizontal reach of the well.
The Geosteering Correlation Tool uses the Log While Drilling log curve to compare to type logs known as Signature Logs to determine the stratigraphic and MD position of the wellbore. Once a correlation is made between the Log While Drilling log and the Signature Log in the Geosteering Correlation Tool, a copy of the scaled Signature Log is place at the measured depth of the correlation point within the cross section. The geologist can then compare the Signature Log tops to the 3D geological model and make corrections to the model as necessary.
GridXchange
GridXchange provides users with an interface and engine for transferring information from IsoMap Grids and Data Points into OpenWorks grids and point sets. The utility allows you to transfer IsoMap grids and IsoMap point set data from a discovery Project to an OpenWorks project. The GridXchange Utility allows you to utilize interpretations made in Discovery in other applications that utilize OpenWorks grids and point sets, such as PowerModel and ZMap.
IsoMap
IsoMap is the comprehensive surface modeling and contouring application for GeoGraphix Discovery. You can create a wide variety of contour maps, grids, and color renderings including faults for display in GeoAtlas and XSection. IsoMap layers are typically created in GeoAtlas; in addition, PRIZM (the log interpretation component of Discovery) and GVERSE Geophysics (the 2D-3D seismic interpretation Discovery module) have the capability of producing IsoMap layers for display and further manipulation in GeoAtlas.
LandNet
LandNet is the Discovery Geology application for importing landgrid and cultural data and creating layers based on these data. LandNet accepts data from a variety of commercial and government sources. The application is designed to manage cartographic data including survey data (e.g., Jeffersonian, Texas, Canadian, etc.), political boundaries, transportation, hydrography, and many other map features which provide a visual representation of the location and layout of an area of interest.
LeaseMap
LeaseMap® is the Discovery™ mineral interest and leasehold mapping system that enables analysis of land ownership for a geographic region. Using LeaseMap, you can map land ownership positions for your company, partners, and/or competitors. For example, you can quickly determine the mineral interests of a particular company, the working interest of a company on an isolated piece of land, or leases that expire in the near future.
Lease Planner
Lease Planner is used to define your drillable acreage using Shapefiles or Arc GIS feature services. Using Shapefiles, areas can be defined where pads and wells are located. Setback can be applied around these areas to define surface constraints, along with the application of the intercept buffers around the pre-existing wells in your area.
LogM Digitizer
The LogM Digitizing program is used to convert paper copies of well logs into an electronic format that can then be used by other LogM programs such as the Well Editor and Model Builder.
PRIZM
PRIZM™ is the GeoGraphix® Discovery™ petrophysical application designed to assist geoscientists and petrophysicists in analyzing and interpreting well log data. PRIZM supports the import of digital data from numerous sources and provides you with integrated data views and analysis. Using PRIZM you can view, edit, and analyze well log data in three different formats.
Production Analysis
The Production Analysis functionality in Discovery allows you to analyze production data stored in the WellBase Information Manger and estimate remaining reserves and well life based on the past production history. The functionality is designed to provide the capabilities of the current ResEV application.
ProjectExplorer
ProjectExplorer is the Discovery™ application for creating, activating, organizing, and modifying Discovery projects. ProjectExplorer has an interface similar to Microsoft® Windows Explorer.
Data Processing
The Data Processing module is designed to allow simple processing methods to be applied to post-stack seismic data. The selected process methods are displayed in a flowchart style and executed in chronological order.
The output files are stored in a user specified directory. In addition, intermediate output can also be defined after any process step.
Plot Log / Synthetics
The Plot Log / Synthetics program is used to preview well logs and synthetic traces generated by the Well Editor, Turbo Synthetics or AVO Synthetics prior to plotting.
QueryBuilder
QueryBuilder is the Discovery Geology application which creates filters and runs queries on a GeoGraphix Data Model ( GXDM) database. QueryBuilder, used in conjunction with WellBase, LeaseMap, and SeisBase, gives you the power to selectively access data by searching the database for wells, tracts, leases, or seismic lines based on user-defined criteria. By filtering the database, you avoid managing a potentially large number of wells, leases, tracts, or seismic lines and instead work with only a subset of wells, leases, tracts, or seismic lines that meets specific criteria.
Reformat Wells
The Reformat Wells program is a convenient central location used to import well log data from a variety of industry formats into LogM including LAS, QC/IDC and LOGarc. Well log files and cross sections in the original legacy DOS LogM format can also be imported.
SeisBase
SeisBase is the seismic data management tool of the Discovery Geology software. SeisBase allows you to import seismic survey location data, along with selected attributes associated with interpreted seismic horizons. Further, SeisBase has the capability of creating display layers of the seismic surveys and attributes in GeoAtlas. These layers can also be used to generate gridded contour and color density maps using IsoMap.
SeisXchange
SeisXchange™ is available only if Landmark Connect (the ability to access OpenWorks® and SeisWorks®) is installed on your system. SeisXchange and SeisWorks enables users to transfer seismic data files plus 2D and 3D Horizons and Faults between GVERSE® Geophysics and SeisWorks without tedious export-import operations. The SeisXchange application is launched from the Xchange Toolbox in any discovery application.
Struct
Struct is a comprehensive forward seismic structural modelling tool that is used to determine the seismic response of complex geologic structures in areas where there is little or no well control.
It combines an easy-to-use interface for creating complex geological cross sections and powerful synthetic trace generation tools for producing accurate seismic response models.
Struct is made up of two programs. The Model Entry program for creating structural models and the Model Viewer program for viewing and plotting trace models.
Integration program
Integration refers to the process of transferring well or model data between LogM and Discovery applications.
Every time Well or Model data is transferred between LogM and Discovery, the request is handled by the translator program.
Turbo Synthetics
Turbo Synthetics is the fastest and easiest way to generate professional looking synthetic trace plots from well log data. This enhanced version of Turbo Synthetics offers many new features that improves the established functionality geophysicists have come to rely on.
Wavelet Extraction
Wavelet Extraction is a separate program which opens after the extract wavelet process is first started in the Well Editor.
In the Well Editor, the initial step was selecting the Tools->Extract Wavelet option and displaying and aligning the input datasets.
Once the extraction method was chosen, the Wavelet Extraction program opens with the extracted wavelets displayed.
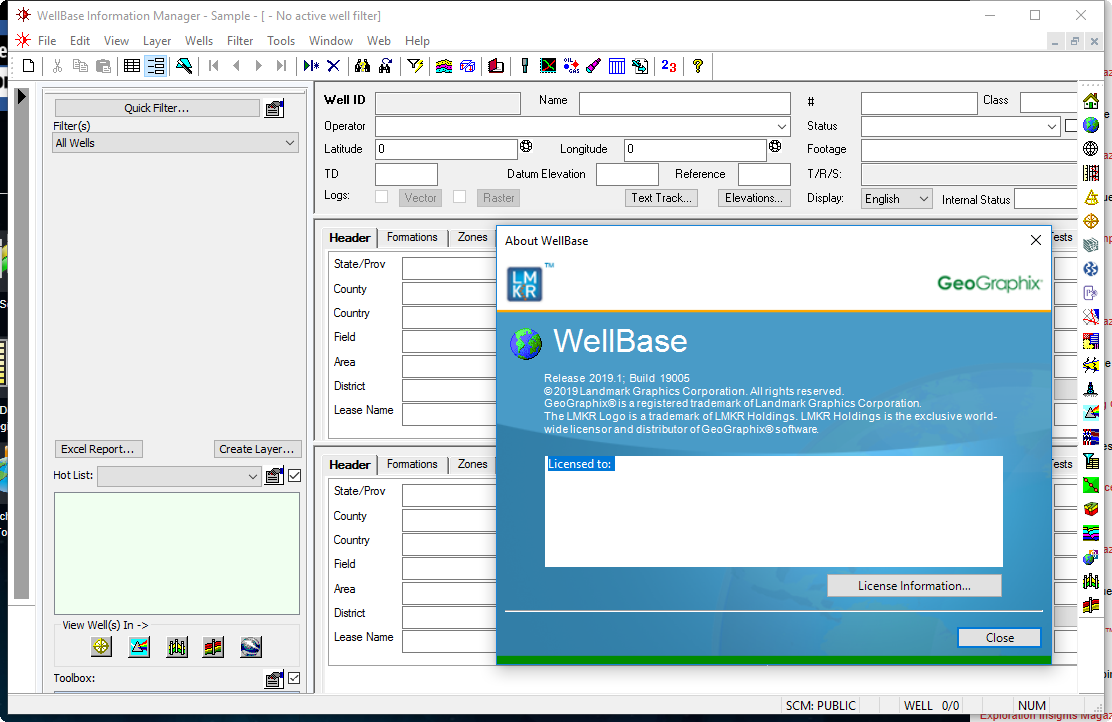
WellBase
WellBase™ provides access to a relational database management system for geologic well data, including formation tops and deviation surveys. WellBase stores its data using the GeoGraphix® Data Model (GXDM). This model is based on an industry-standard well data model called the Public Petroleum Data Model (PPDM). The GXDM is common across all GeoGraphix Discovery applications, allowing multiple-application data integration.
WellBase is available for use in Discovery™ projects and Discovery™ on OpenWorks® projects. Because of the inherent database differences between OpenWorks (Oracle data base) and Discovery (Sybase database), some functions are available in Discovery projects that are not available in Discovery on OpenWorks projects.
WellXchange Plus
WellXchangePlus is the Discovery application that enables users to move well data back and forth between Discovery, and OpenWorks. The WellXchange-OpenWorks Connect option provides the capability of transferring well data between Discovery and OpenWorks in a Microsoft® Windows® environment.
XSection
XSection is the Discovery Geology application for creating, editing, displaying, and printing geologic cross sections. In XSection you can define stratigraphic and structural cross sections using data from WellBase, PRIZM, ZoneManager, IsoMap and SeisVision.
ZoneManager Introduction
The ZoneManager™ application provides for storage, display, and analysis of well data on a zone basis. Using ZoneManager, you can define multiple zones, define a large number of associated attributes for each zone, and input attribute data for each well in the project. Attributes can be of numeric, date, or text data type.
تیم PetroTools آخرین نسخه این نرم افزار را برای شما ارائه می دهد. جهت تهیه نرم افزار با استفاده از منوی خرید با ما در تماس باشید
For buy software, Please contact us via buy menu