

 O-Sense
آنالیز تست چاه | PIE Well-Test Analysis 2023
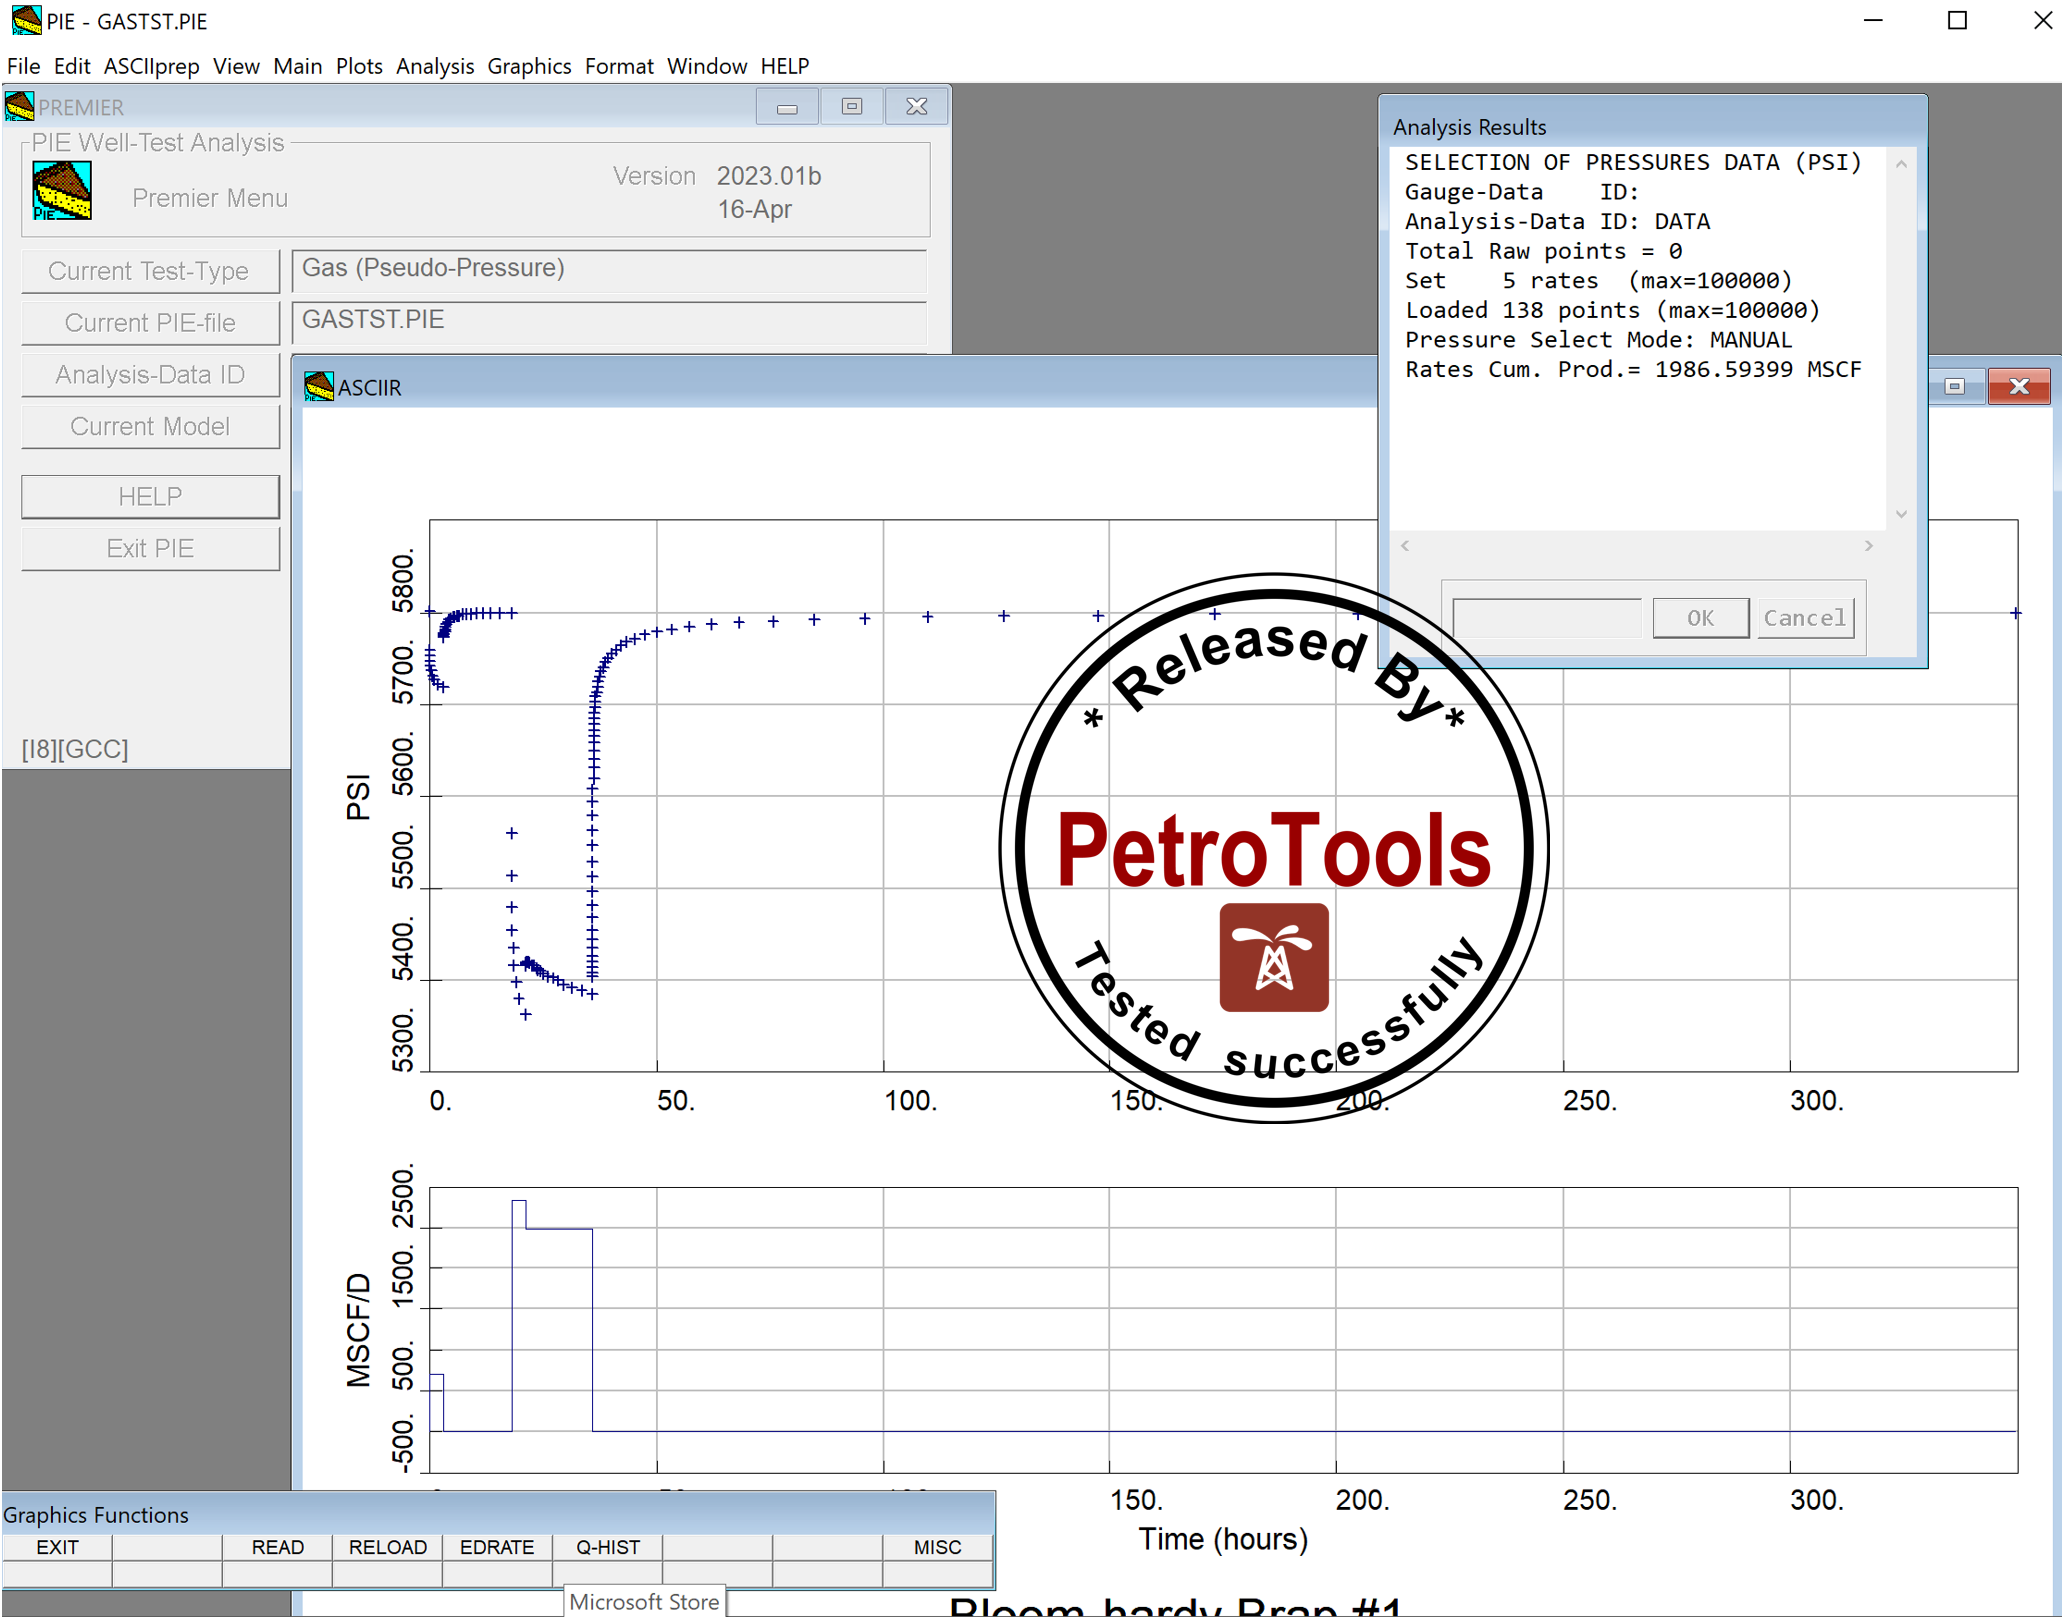
PIE Well-Test Analysis operates in a window environment i.e. plots and menus are displayed in individual windows and the mouse is used to select options. The Menu-Bar contains all of the pull-down menus that list the options needed to set-up data and analyze a test. Where appropriate, a menu-bar option will display a window with a menu of additional choices, a table to fill in with required data, or a plot with graphics functions to carry out specific analysis tasks. Everything shown by the program can be selected and controlled with the mouse. Just "click" on what looks interesting and something will happen.

PIE works with a set of information called analysis-data. This data comprises all of the rate, pressure, and static parameters needed to analyze a well test. The analysis-data can be stored in a PIE-file. The program works with the analysis-data as if it were a "document" i.e. it is created or read from a PIE-file, manipulated, and only saved when you specifically choose to save it to a PIE-file. PIE works with one set of analysis data at a time.
Data being entered into tables is incorporated into the analysis-data only after explicitly selecting the "OK" command. This rule is true for ALL data entry in the program. The "OK" command command is shown at the bottom of the table (like a button) or can be invoked by hitting the "RETURN" key on the keyboard. This mode of operation ensures the analysis-data is changed only when you want it to be changed.
To prepare test data, use the FILE, EDIT, and ASCIIprep pull-down menus on the menu-bar. The FILE pull-down menu contains the options for opening existing PIE-files, creating a new PIE-file, and various other system operations (e.g. printing). The EDIT pull-down menu contains the options to manipulate all the analysis-data. The ASCIIprep pull-down menu contains the options to prepare analysis-data from raw gauge-data supplied by a service company in ASCII text files. Note that the EDIT pull-down menu includes the standard "Copy" and "Paste" options that allow move data between PIE and another application (e.g. a word-processor or spread-sheet).
Analysis plots can be displayed using the PLOTS pull-down menu. Once an analysis plot is available, the ANALYSIS pull-down menu can be used to select the options to display diagnostic graphics functions, select a type-curve model, and match the model to the test data. The basic analysis in PIE operates around the idea of matching a type-curve model to the data. A type-curve model is used in a "Type-Curve Simulation" to create the true analytic solution for the specific set of data be worked on. The type-curve simulation uses the full and complete analytic solutions for the selected model i.e. each model uses lots of wonderful Bessel functions, Green's functions, Fourier transforms, Laplace transforms, etc. to create the type-curve.
For those of you so inclined, a more traditional analysis using straight-lines on various plots is available. This type of analysis uses the option under the ANALYSIS pull-down menu to select a type-curve model which controls what graphics functions are displayed on the analysis plots. Any of the plots listed under the PLOTS pull-down menu can be used. The complement of graphics functions for the analysis is complete so a full set of results can be obtained for each type-curve model.
As a suggestion to get started, use the "Open PIE-File" option under the FILE pull-down menu to load the default set of test data from the PIE-file named "TSTDAT.PIE". Then select the "Derivative" option under the PLOTS pull-down menu to display a derivative plot of the test. Then do the following steps:
1) Select a vertical-well in a homgeneous radial reservoir as the type-curve model.
2) Use the "UNITSL" and "STABIL" graphics functions to place a unit-slope (for wellbore storage) and a radial-flow stabilization (for permeability and skin) on the derivative plot
3) use the "Set-up Simulation" option under the ANALYSIS pull-down menu and then select the option to "Do Simulation".
4) play with the options under the ANALYSIS pull-down menu and look at the option "Optimize Fit" to find the best match.
تیم PetroTools آخرین نسخه این نرم افزار را برای شما ارائه می دهد. جهت تهیه نرم افزار با استفاده از منوی خرید با ما در تماس باشید
For buy software, Please contact us via buy menu