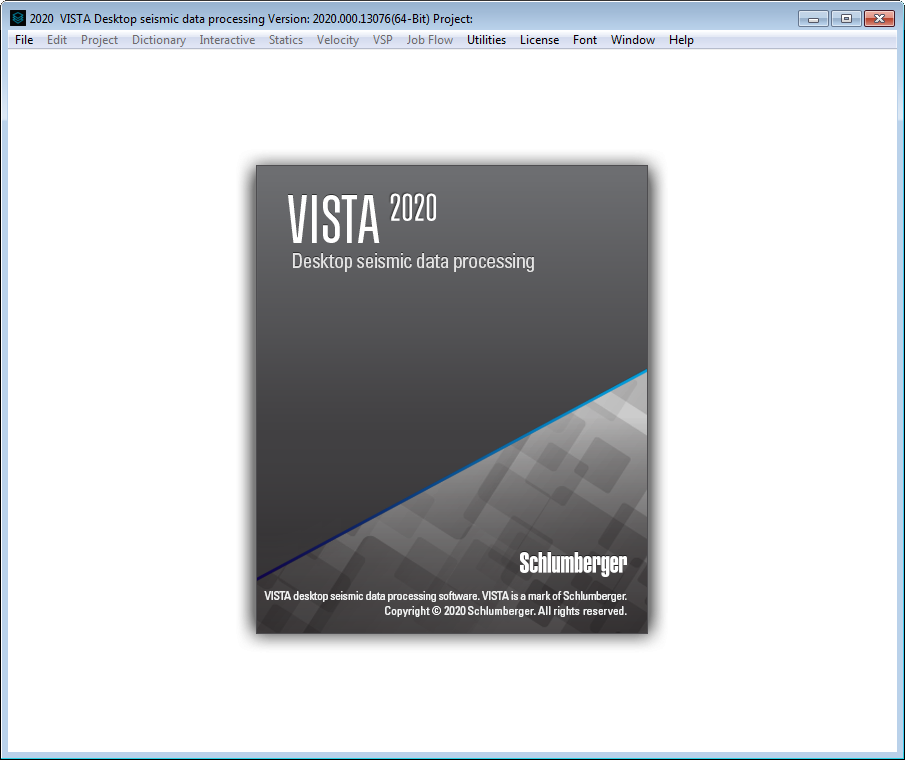
پردازش اطلاعات لرزه ایی | VISTA 2020.1

VISTA desktop seismic data processing software provides data processing from early-stage acquisition QC to final processing and interpretation of 2D and 3D seismic data acquired on land or offshore or as a vertical seismic profile (VSP), in all industry and manufacturer data formats. With VISTA software, you can easily navigate workflows and seamlessly evaluate datasets using the interactive and interlinked displays. You can also add in your own algorithms through a C++ or MATLAB SDK interface. The software supports advanced processing capabilities, including AVO/AVA analysis, multicomponent processing, and 2D and 3D VSP processing.
The software is available in four modules:
- VISTA Field QC is used in the field to perform rapid QC and simple processing up through a brute stack.
- VISTA Field Pro package provides additional tools for today’s more sophisticated QC requirements, including poststack migration.
- VISTA Full Pro offers a complete QC and processing solution, with all the field capabilities, and includes poststack line-tie and data merge, prestack migration, and time and depth image analysis.
- VISTA VSP enables complete VSP QC and processing.

Release updates
Receiver orientation analysis tool added to interactive 3C VSP First Break picking analysis tool. The new capability estimates receiver orientation relative to the global coordinate system, performs polarization analysis, and applies polarization and true vertical rotation.
New flow commands
- Python flow command for executing Python files to process single trace or ensemble gathers
- Write SEG-2 Output command

Elevation Refraction Statics with Tomography
- Improved runtime of the algorithm for 3D tomographic velocity inversion
- New display views to help QC 3D tomographic model in three dimensions
- Calculation of short wave statics or theoretical first breaks based on layer or tomographic velocity model
Velocity Analysis
- Improved mute operations
- Math functions to selected velocities or ETA values
- Horizon display options within IVA window
- Auto-save VISTA software velocity file functionality
- Enhanced velocity/eta table to read and write text files containing velocity pairs
- Hotkey “Z” to toggle gather mouse control from mute to zoom mode
Surface Velocity window
- New display options for horizons and more options to handle inline and crossline numbering
- Hotkey “E” to toggle the display of empty controls on/off
Interactive Stack window
- Link between surface base map window and picking window for velocity QC
- Load and display horizons loaded from Omega geophysical data processing platform DIO headers, VISTA software headers, VISTA software picked horizons, or from a text file
- More options for horizon display
- Output picked velocity in various formats including VISTA software, Omega platform, and Velman
- Functionality for quick access to CDPs and lines through new GUI controls and new menu options to access display, color bar settings, etc.
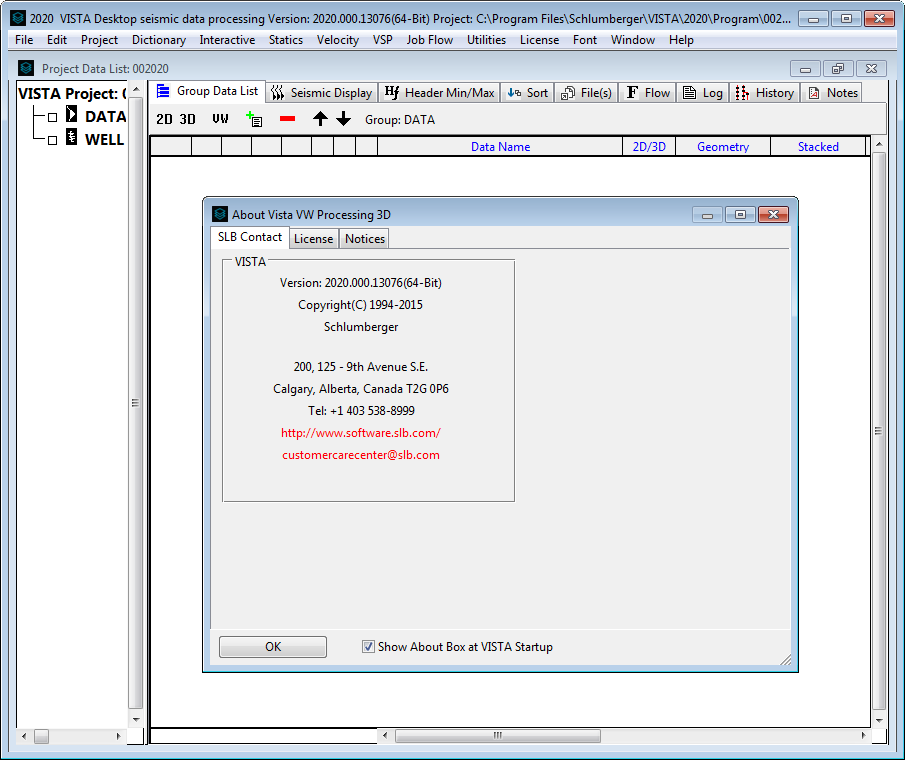
Project Data List window
- User-customizable Group data list; ability to interactively add, remove, and reorder columns
- Ability to allows display of additional dataset information
- Ability to dynamically change and interactively move columns for each project loaded
Interactive Windows
- Measure tool mouse option to measure area, angles, and length between points to the Interactive 3D Land Geometry, Interactive Attribute, and Interactive Surface Velocity window
- Display gridded attribute numeric values in the Interactive Attribute window
- Options added to the Interactive Surface Velocity Window to control the display of horizons and the display of inline and crossline numbering
- New function that counts the number of traces within a defined selection area to the Interactive Header window
- Ability for users to specify value search and display its corresponding record in the seismic sort index dialog (for example, enter a value specific to the defined sort, i.e. enter the
- SHOT_POINT_NO to display that particular record, enter FIELD_STATION_NO to display a particular record when the data is sorted in receiver order, etc.)
- Group sort display option added to the sort tab of the Seismic Data Plot Parameters dialog for defining a dynamic sort header to the display ensemble
-
- Name sorting in ascending or descending order to the Add Header Items to Dictionary dialog in the Edit VISTA headers toolbar
- Read and write options to the VISTA software Header Min/Max Values dialog for selecting multiple headers
- Ability to group header selections using “And/Or” logic operators to define the selection
- New Overlay Data Process settings in the Seismic Montage and Seismic Window display to give more control over display appearance
- Option to restore Flow Window to previous window locations
Flow commands
- 2D VSP Depth Migration: new Gather mode option to output migrated offset gathers
- 3D Ground Roll: removed the option to specify Max Number of stations on input
- Input Flow commands (SegyDisk, Seg2Disk, SegdDisk, DIODisk, etc.): New option to specify if the input data is VSP data
- Ensemble Stack: addition of option to mark output data as stacked
- Remote Instrument File Input: ability to specify if the input data is 2D or 3D and ability to apply MP factor to SEG-D
First Break Picking
- New option to use the pick method when manually picking first breaks
Interactive 2D Geometry Window
- Display and allow direct edit of the currently defined shot patch
- Addition of skids/offset/bearing information through the RMB menu control
Interactive VSP Profile Window
- New options to output the time-depth relation
- Interactive time shift to first breaks
- New velocity layer to include for example the water bottom or the near surface
- Ability to output interval velocities and velocity difference when using Compare mode of different VSP profiles
- Addition of multishot display for vertical incident VSP
- Interactive 2D/3D VSP Model Building Window
- Ability to load variable velocity with 2D horizon
- Improved horizon smoothing for edge effects
- Ability to display rays beyond the bin grid in the 2D and 3D views
- Interactive LAS Log Edit Window
- Ability to display multiple curves within the window
- Spreadsheet editing for log curves
- Ability to edit log tops
LAS Log Display
- Ability to display all tops or select individual tops for display in the LAS Log curve display window
- Sonic Log Calibrate Window
- New picking options
- Pick custom picks off the drift curve
- Interactively move custom picks or change only the value while maintaining the depth
- Load custom picks from a text file with drift values
Pick outside of VSP range
- Options to interpolate, fill/replace, and ignore when the sonic log contains NULL values at the beginning
- The word CALIBRATED to the sonic curve description
- Text output options, including start time reference and custom depth
تیم PetroTools آخرین نسخه این نرم افزار را برای شما ارائه می دهد. جهت تهیه نرم افزار با استفاده از منوی خرید با ما در تماس باشید
For buy software, Please contact us via buy menu


 O-Sense
